The dashboard
The first page after sign in: the state of the estate in a few tiles, and ready made views.
At a glance
- WhereDashboard, address /.
- AccessAny signed in user. Views need the dashboards module.
- DataWhile the inventory is empty, the page sends you to the welcome page.
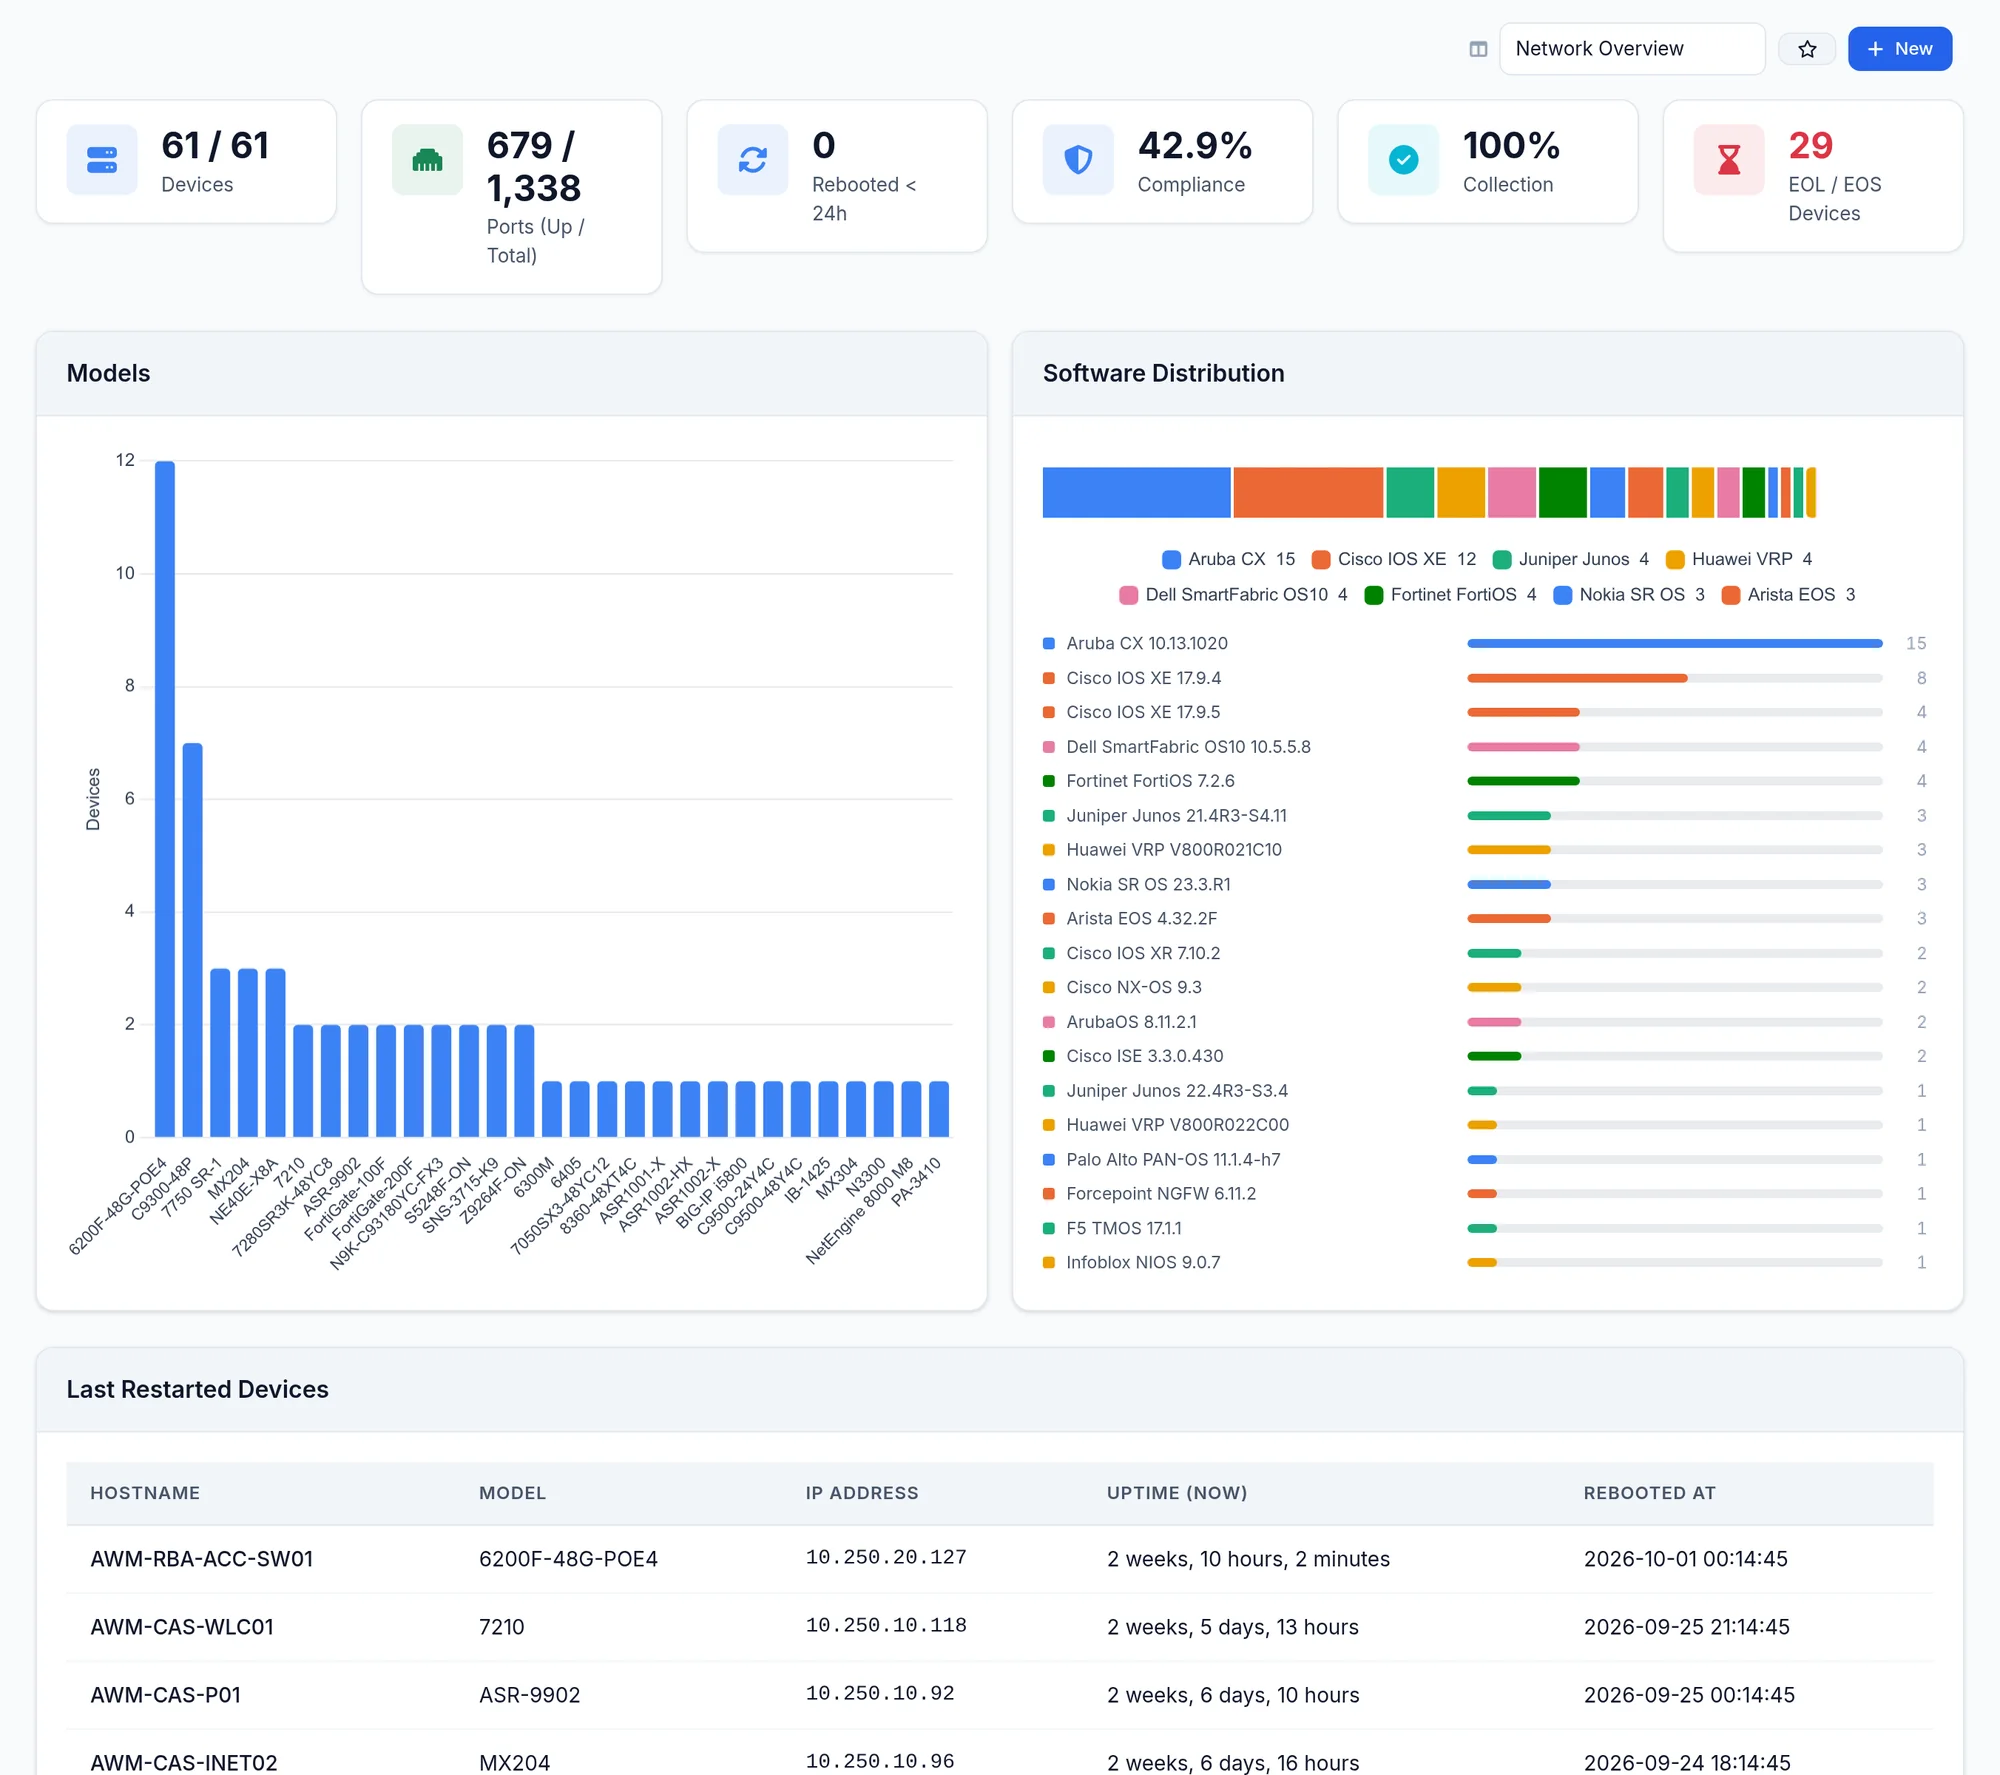
What the screen shows
What you can do
- 1
Open a tile's detail
The Compliance tile opens the compliance report, the end of life tile opens EOL Lifecycle.
- 2
Create or edit a view
New or Edit in the view selector: you need the permission to manage dashboards.
Limits and things to know
Built-in view names are in English
In this version they are not translated.
Read next
Manual
Devices
The list of managed and discovered devices, its filters, exports and actions, then a device's own page and its tabs.
ManualCompliance
How to run rule evaluation, read the estate and per device scores, set a waiver on a check, and export the findings as PDF, XLSX or CSV.
ManualEOL lifecycle
The end of sale and end of support dates of your models, the devices at risk within 180 days, and how the lifecycle catalogue updates.